
Transforming Data into Accessible Visualizations for Positive Change
The World Health Organization (WHO) is committed to building a world in which all people attain the highest possible standard of health and well-being.
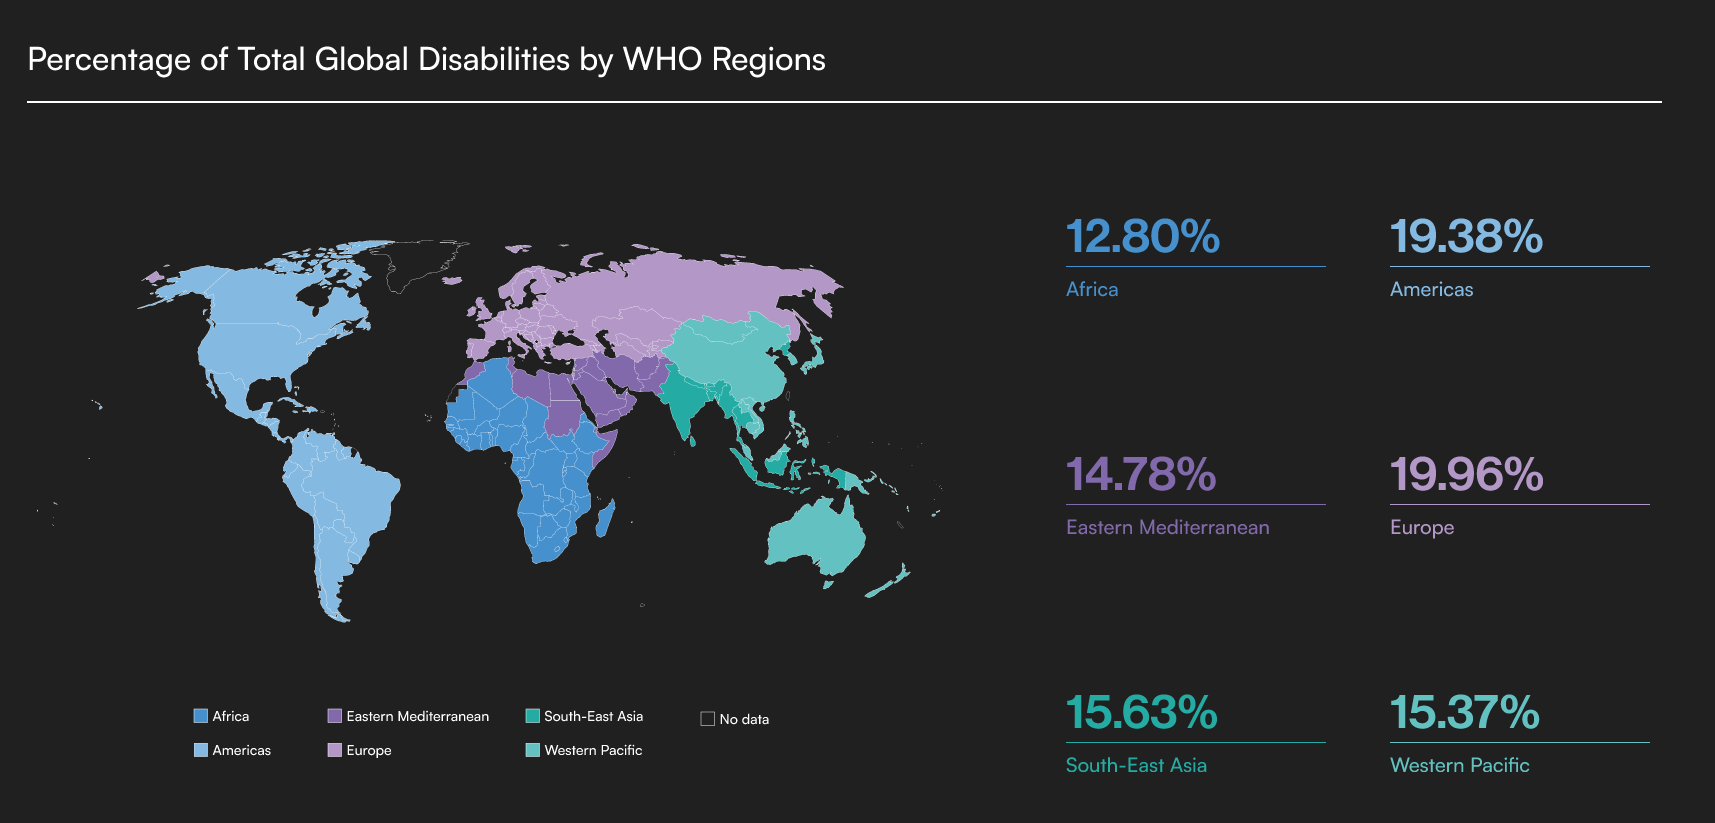
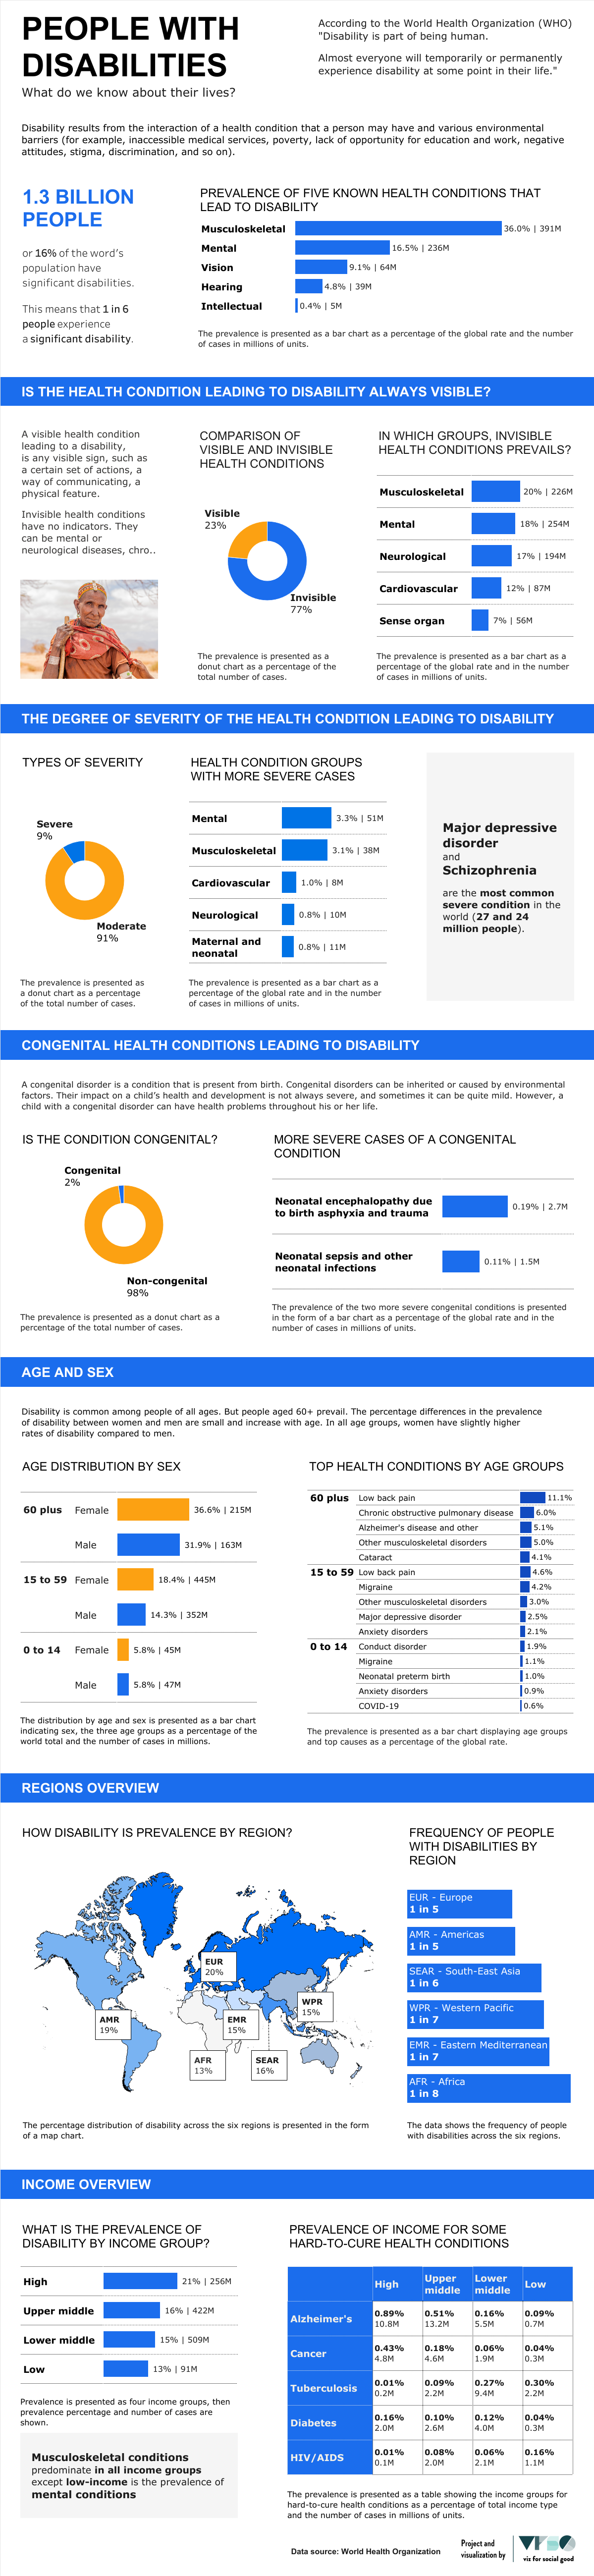
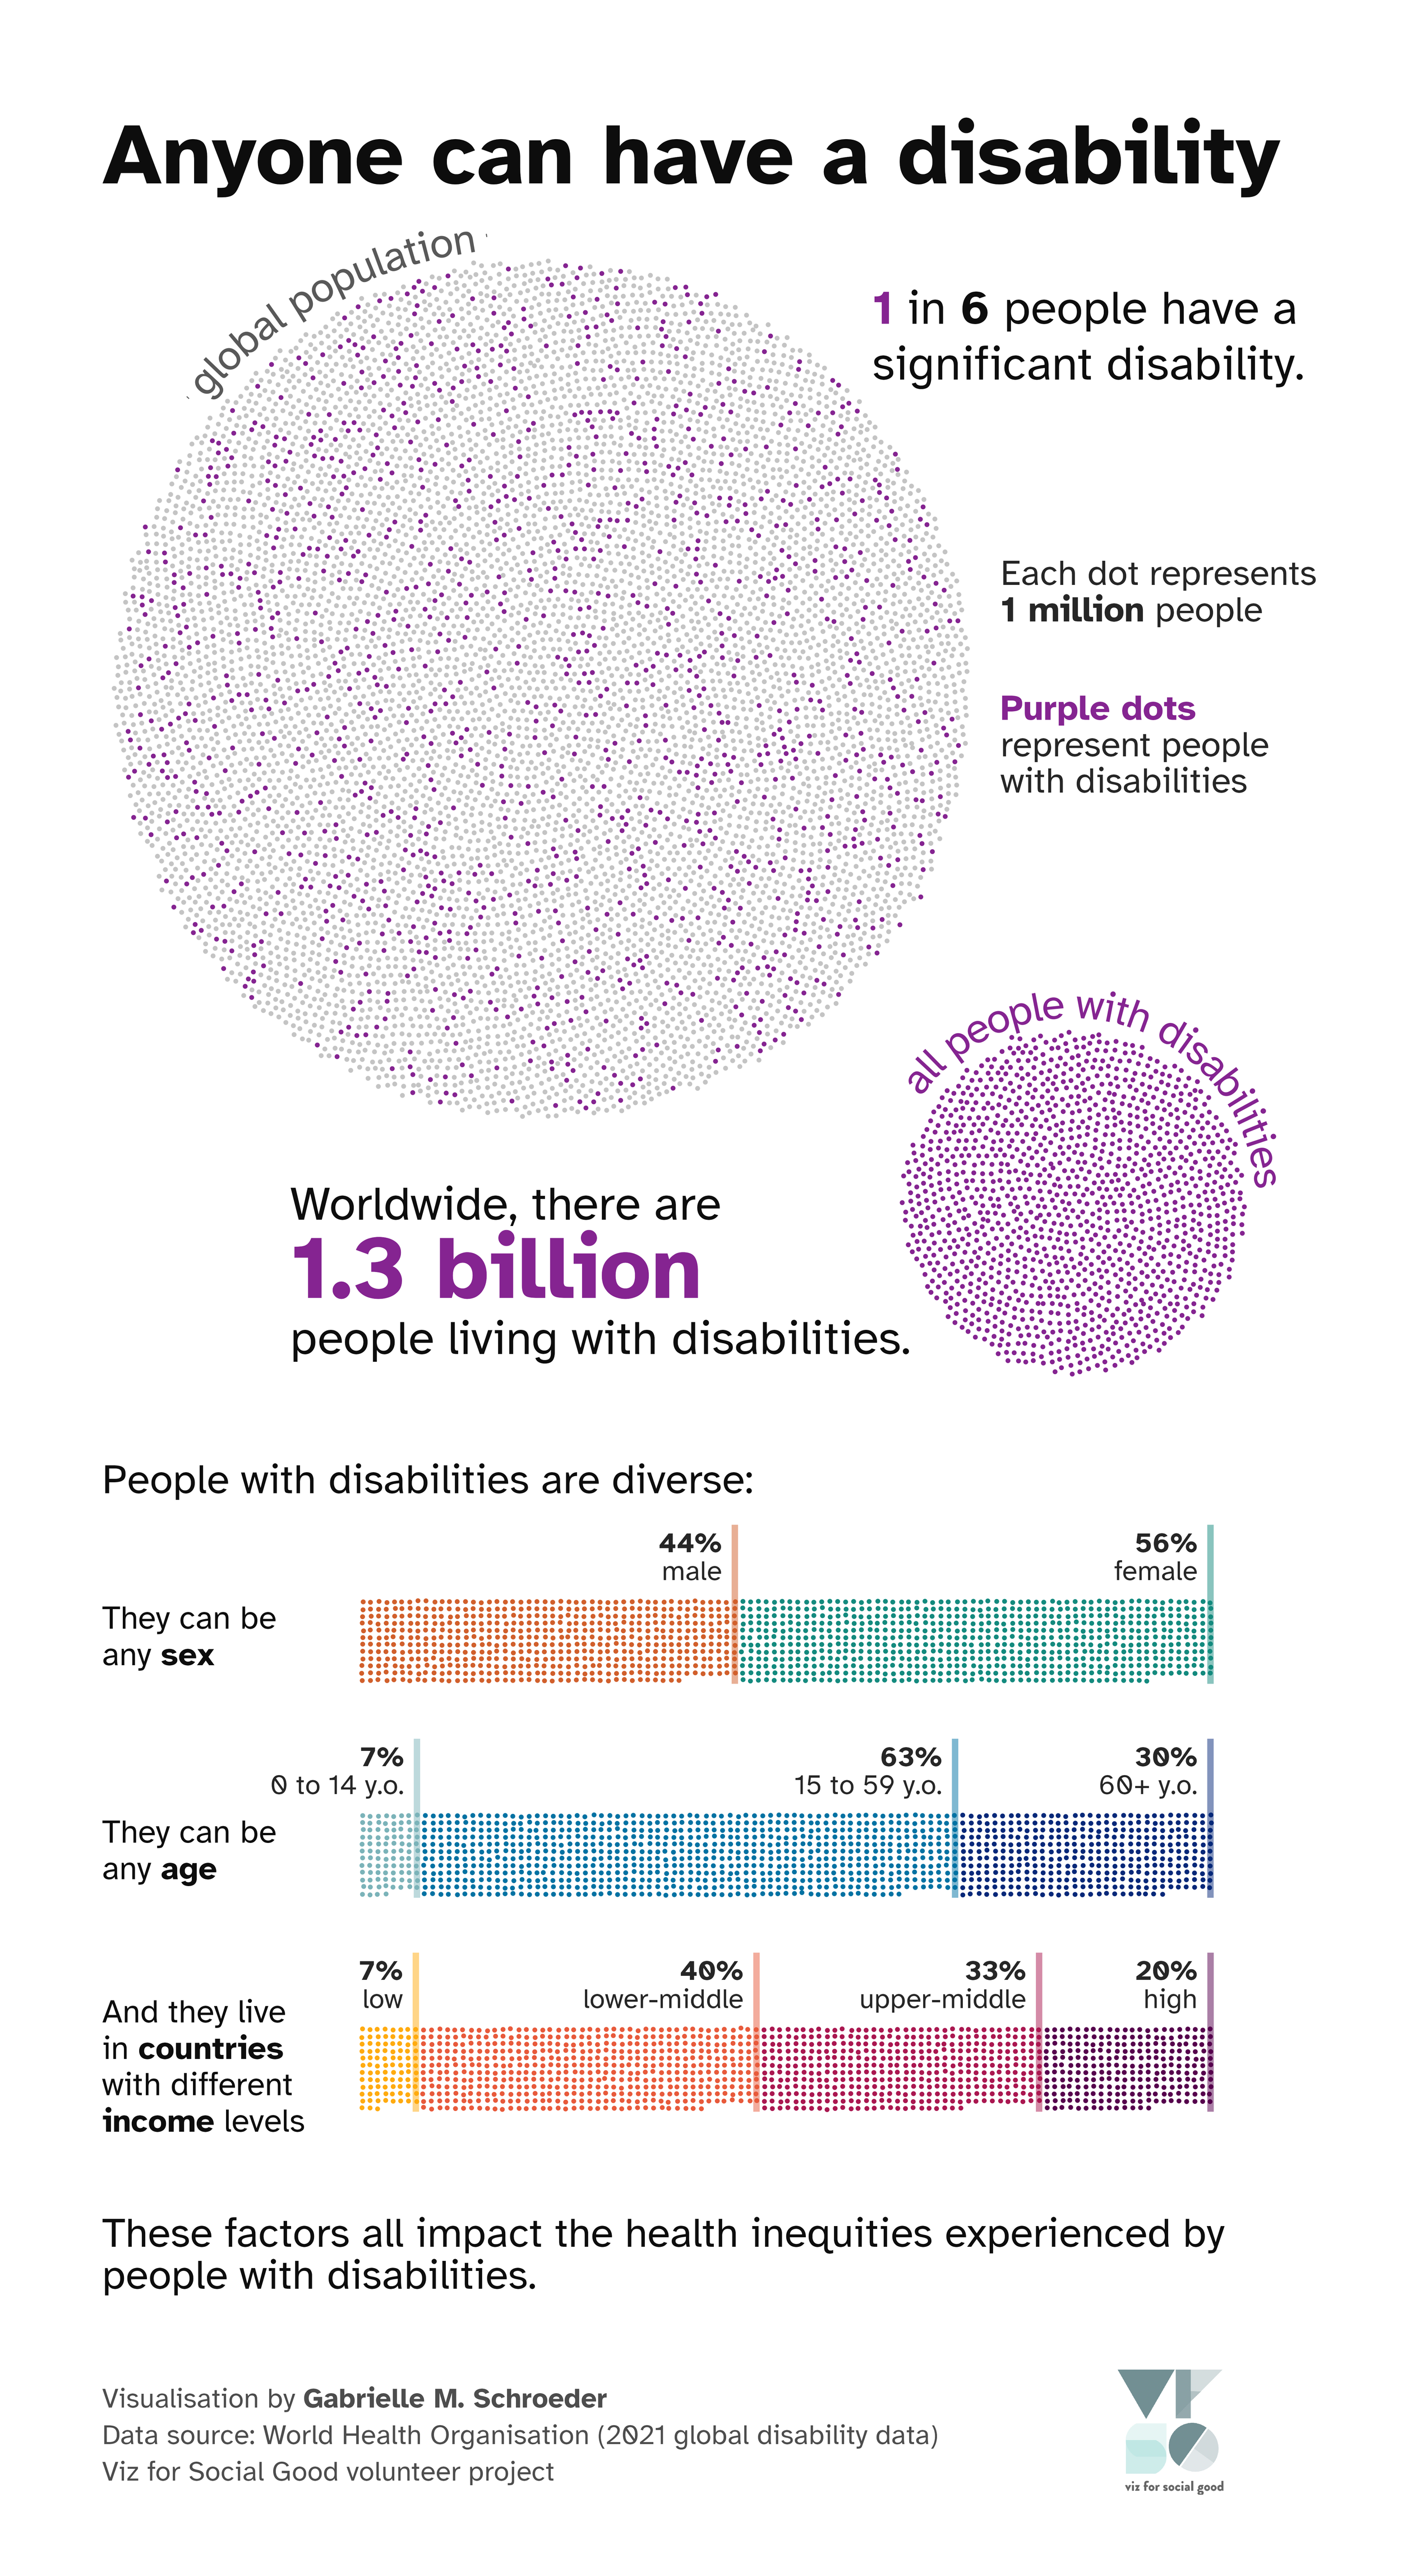
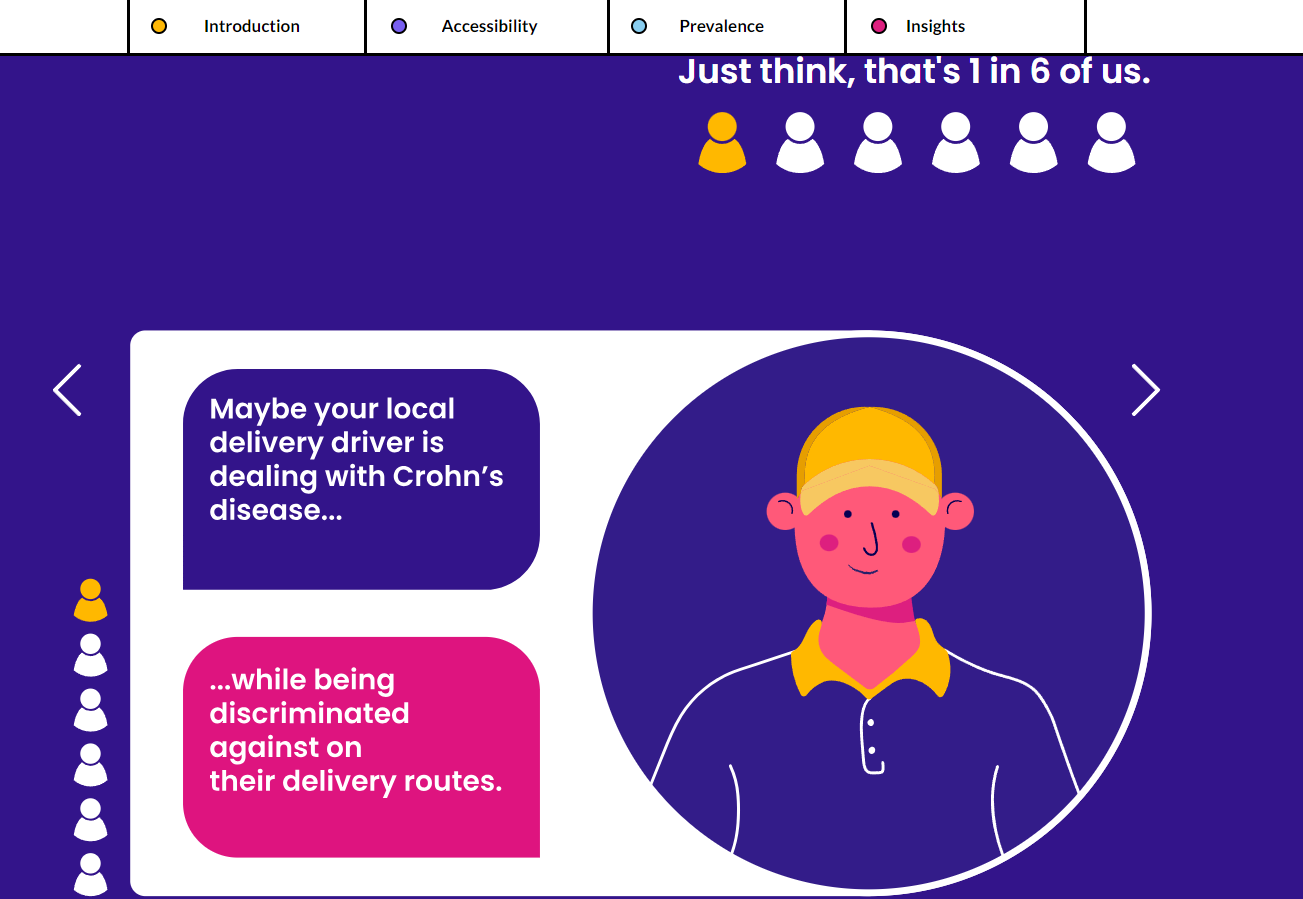
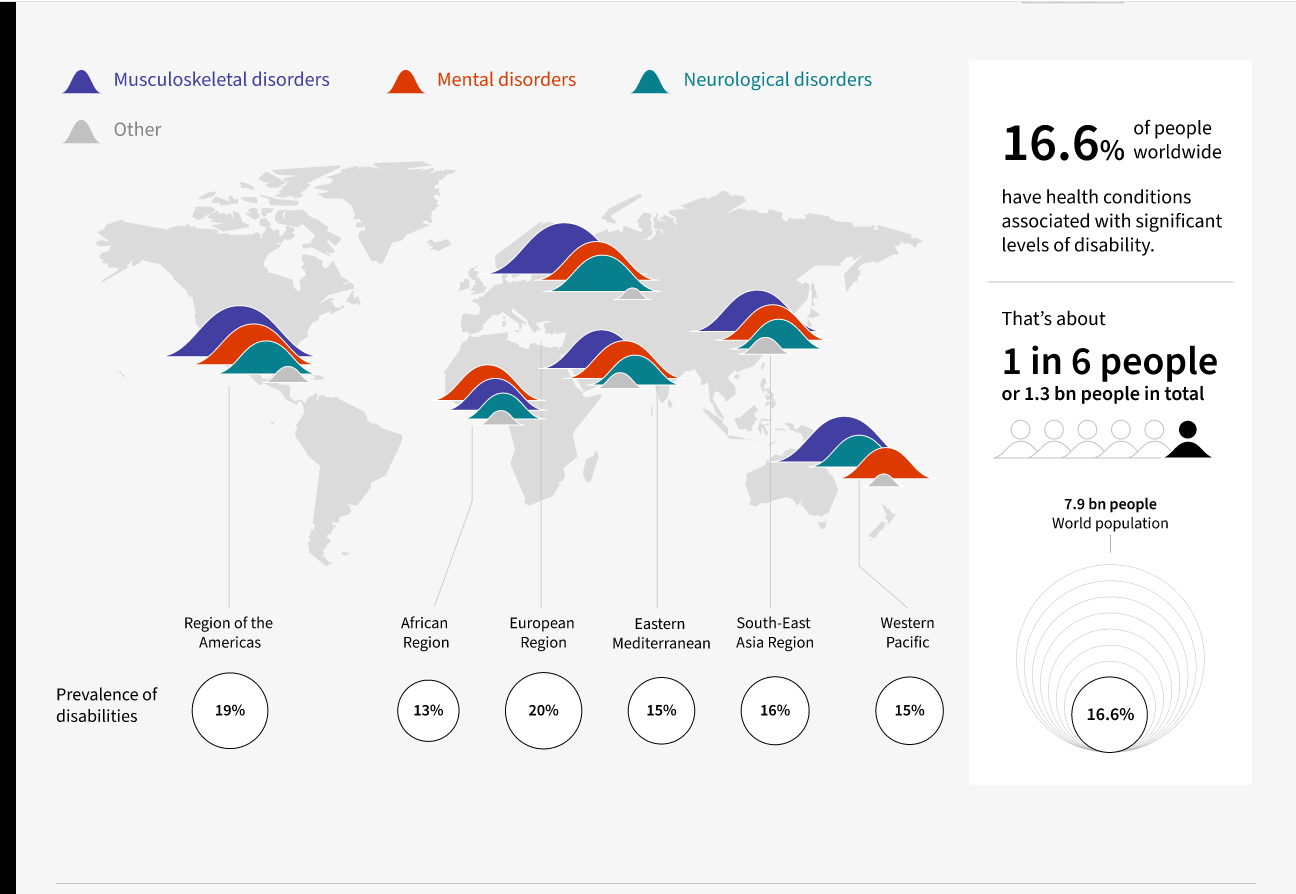
Nearly 1.3 billion people, or 16% of the world's population, have a significant disabilities. Persons with disabilities deserve the same right to good health as anyone else. Our healthcare systems need to be accessible and inclusive for everyone, including persons with disabilities.
About the Project
Breaking down barriers to health equity through disability inclusion
WHO's report on health equity for people with disabilities shows we still have a long way to go. People with disabilities still die earlier, have worse health, and face more challenges in their daily lives than others. Countries are legally obligated under human rights law to tackle these health disparities for people with disabilities. We must ensure everyone has access to good health to achieve Sustainable Development Goals and global health targets.
The report urges WHO Member States to improve health equity for individuals with disabilities. It invites civil society, including disability organizations and other health stakeholders, to work together and advocate for the adoption of the report's recommendations and strive for optimal health for all.
It offers 40 concrete and comprehensive actions nations can take to improve their health systems and eliminate health disparities for individuals with disabilities. No matter the circumstances or resources available, all governments and health partners must commit to placing health equity for individuals with disabilities at the forefront of health initiatives, empowering and involving these individuals, and monitoring their outcomes.
Call to Action
Help Viz for Social Good illustrate the power of digital accessibility and create a more inclusive experience for all. We need visuals that are easy to understand and can pack a punch. Get creative and don’t be afraid to think outside the box.
Target Audience
General public, member states, international donor communities, and academia.
Use of Data Visualization
Websites, social media, reports, advocacy presentations, and other communications.
Data
· NOTE: You have exclusive rights to use the photographs solely for the purpose of the challenge. WHO retains the right to restrict use of photographs provided.)
Tools
We respect your tool of choice; for this project, we encourage you to use an opensource tool such as Kendo UI or one of the following for your visualization: ESRI ArcGIS, MS Power BI, R-Shiny and Salesforce Tableau.
Guidance
To create an inclusive digital environment, it's important to strive for universal access. This is a comprehensive idea that goes beyond just accessibility, and considers various elements such as cultural, economic, linguistic differences, along with the needs of individuals with disabilities, to ensure that everyone can fully participate without any barriers.
Make sure your visualization is clear, easy to understand, and accessible to as many people as possible. Please comply with web accessibility standards from W3C WCAG 2.1 and the WHO data design principles. Check out some evaluation tools on the W2C site for web accessibility that assist in assessing whether web content complies with accessibility standards.
Use appropriate labeling, scales, and colors.
Make sure that your visualization is also readable by screen readers and provide alternative forms of representation.
Be sure to include a variety of visuals that are interactive with synchronized filters for Highlights, Proportion, Table, Map, and Text.
Once you've finished your visualization, submit it to the competition indicating which tool you used to create the visualization, as well as a brief narrative to:
explain the question or insight you were exploring, and the choices you made in creating the visualization.
explain how you have considered “universal access” and “accessibility” in your design and implementation.
When you submit your work, please let us know if we have permission to share your submission publicly. Some submissions may be featured in an online visualization gallery as examples of well-designed, accessible visualizations to inspire others in their data visualization efforts and create awareness about disability and health equity.
When evaluating visualizations, we will be examining:
Design - ensuring adherence to universal access and accessibility standards (WCAG 2.1),
Impact - making sure the message is communicated effectively,
Storytelling - bringing the data to life, making it easier for the audience to understand and remember the key insights.
NOTE: Please be advised that we reserve the right to reject any submissions that do not align with the values, theme, or purpose of the challenge.
Key Dates
Kick-off: 18 April 2023 | Recording
Deadline for submission: 23 May 2023 | Submission form
Live presentation: 6 June 2023 | Recording
Selected volunteers submissions (click image in carousel)
Support
Use Slack to ask questions #02_project_discussion
We are also going to try #feedbackfriday on Slack. Connect on Fridays to ask or give feedback about your data visualization.