
Physicalizing Data for a Better World
Calling all data enthusiasts and imaginative minds: Have you ever considered how it would be to experience data in a physical, tangible form? If so, get ready for VFSG’s Physicalizing Data for a Better World—a unique collaborative project that brings imagination, data visualisation, and storytelling together in a way you've never seen before.
Physicalizing Data for a Better World
About the Project
What is Data Physicalization?
Data physicalization goes beyond traditional data visualization by converting digital insights into three-dimensional, physical objects. It’s a bar chart assembled from Lego blocks or a scatter plot designed using a variety of cupcakes. The goal is to make complex data relatable, intuitive, and physically interactive.
Examples of Data Physicalisation
Climate Change: Imagine representing global warming trends through layers of coloured sand in a glass jar.
Ocean Acidification: Create pH level indicators using different shades of blue marbles in a fish tank.
Sustainability: Utilise reusable items to construct a bar chart showing recycling rates in various regions.
Pollution: Develop a cityscape model where the height of buildings corresponds to pollution levels in different areas.
Our Project Focus: Environmental Impact
This project's primary objective is to showcase environmental impact. You should aim to develop physical objects that vividly and tangibly depict the data surrounding pressing environmental concerns — from pollution and ocean acidification to sustainable solutions that reduce, reuse, or recycle elements.
Intergenerational Collaboration
We’re combining the seasoned understanding of data professionals with the vibrant imagination of younger minds. Whether you're an adult pairing with a child, a teacher with a student, or simply connecting to your inner child, all collaborative efforts are welcome.
Note: AI-generated images will not be accepted; the emphasis is on tangible, physical representations.
Call to Action
Capture a photo of your finished physical data object to share with us.
Document your journey from concept to final product.
Tell us how you worked collaboratively to bring your data physicalization to life.
Create a brief video (1 minute or less) highlighting the most memorable moments of your project.
Target Audience
Data Enthusiasts: Engage with data in a new way.
Young Creatives: Bring data physicalization into your school projects or extracurricular activities.
Families: Participate in an enriching and educational family venture.
The Curious: If you don't fit the above categories, channel your younger self and unleash your creativity.
Key Dates
Project Live Kick-Off: October 19 | Recording
Submission Deadline: November 19 EOD | Submission form
Live Presentations: VFSG Summit December 1 | Recording
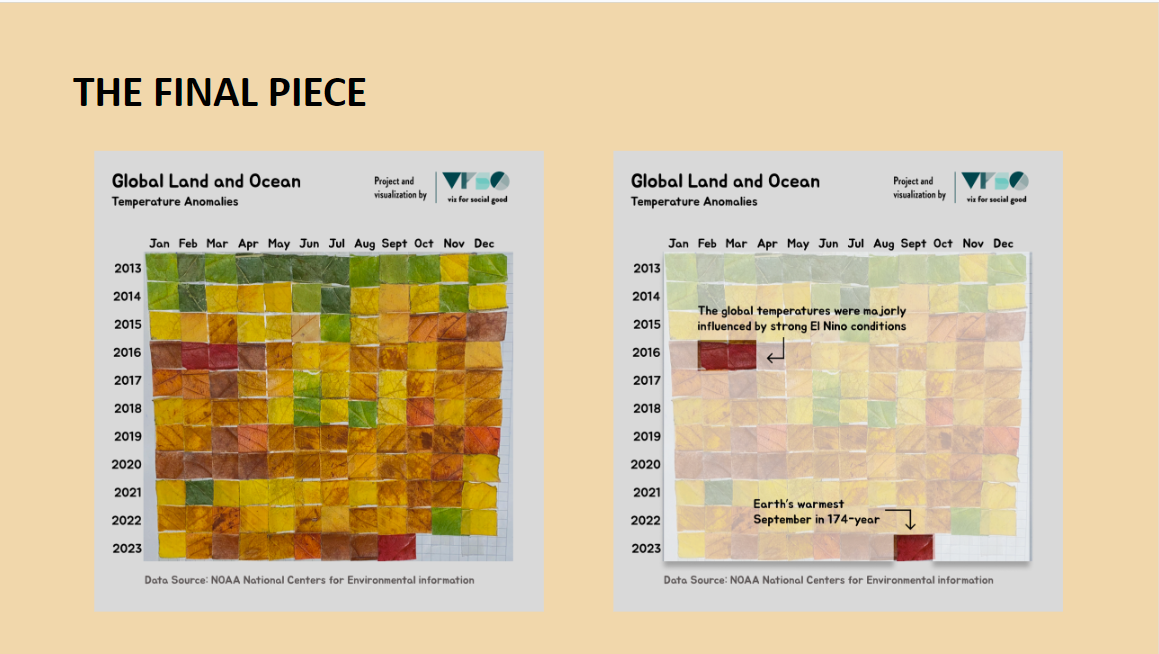
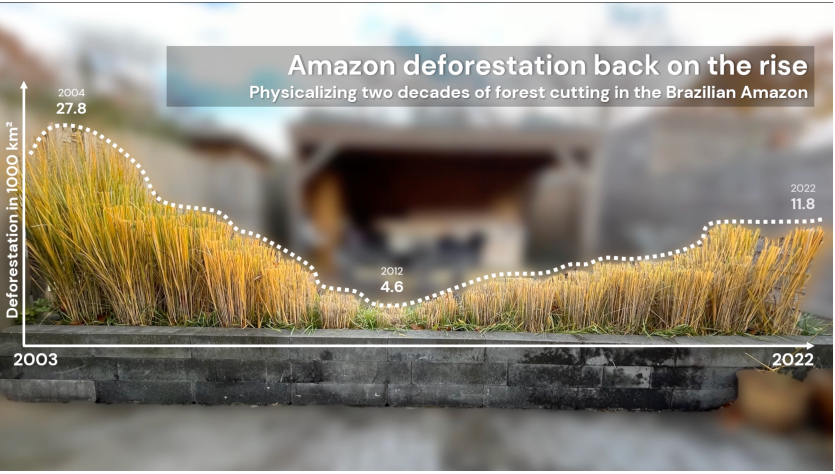
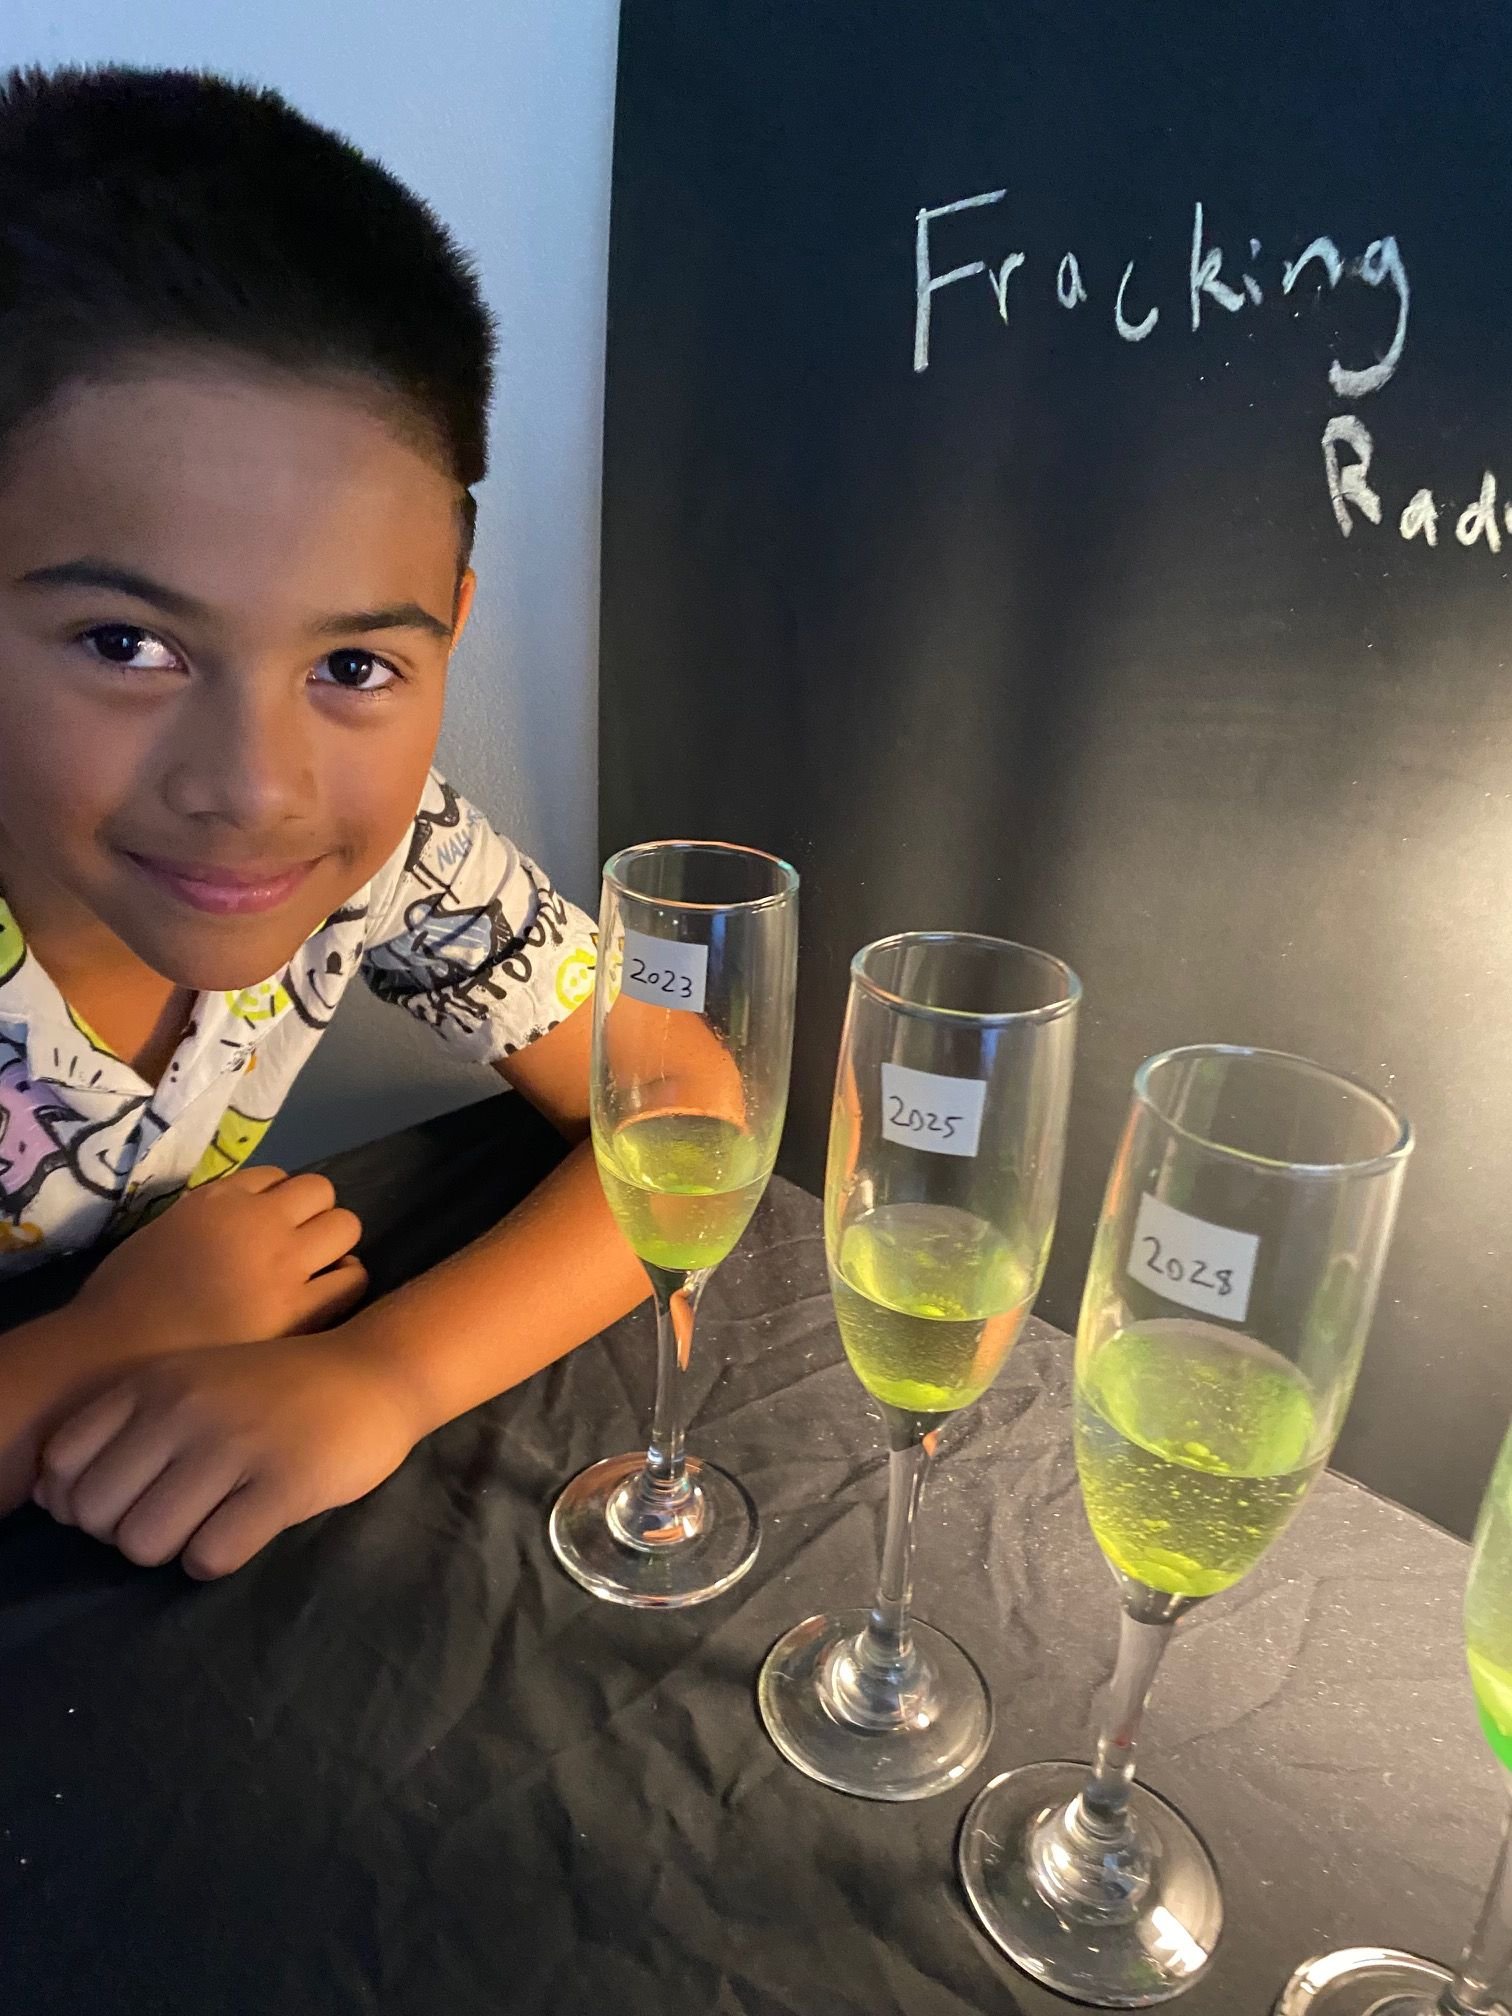
Selected volunteers submissions (click image in carousel)
Victor Muñoz
Mandy Spaltman
Damien Da Costa
Data
Choose from a rich array of environmental data sets:
Alternatively, research for other environmental impact-related datasets or collect your own data for a personalized touch.
Resources and inspiration
If you plan to join in with children, you can use some of the data activity & educator kits from Tableau to create your own datasets. (LINK) (LINK 2)
Support
Use Slack to ask questions #02_project_discussion